Usage analytics
The Developers page provides tools to monitor and analyze your platform activity.
To access these tools, navigate to Developers at the bottom of the sidebar in both ElevenAgents and ElevenCreative.
If you are part of a multi-seat workspace, you can switch between data for your account and your workspace.
Analytics
Section titled “Analytics”The Analytics tab includes API Requests, Usage, and Webhooks. You can filter and analyze data by time period (for example, hour, day, month, or year) and at different levels of granularity.
API Requests
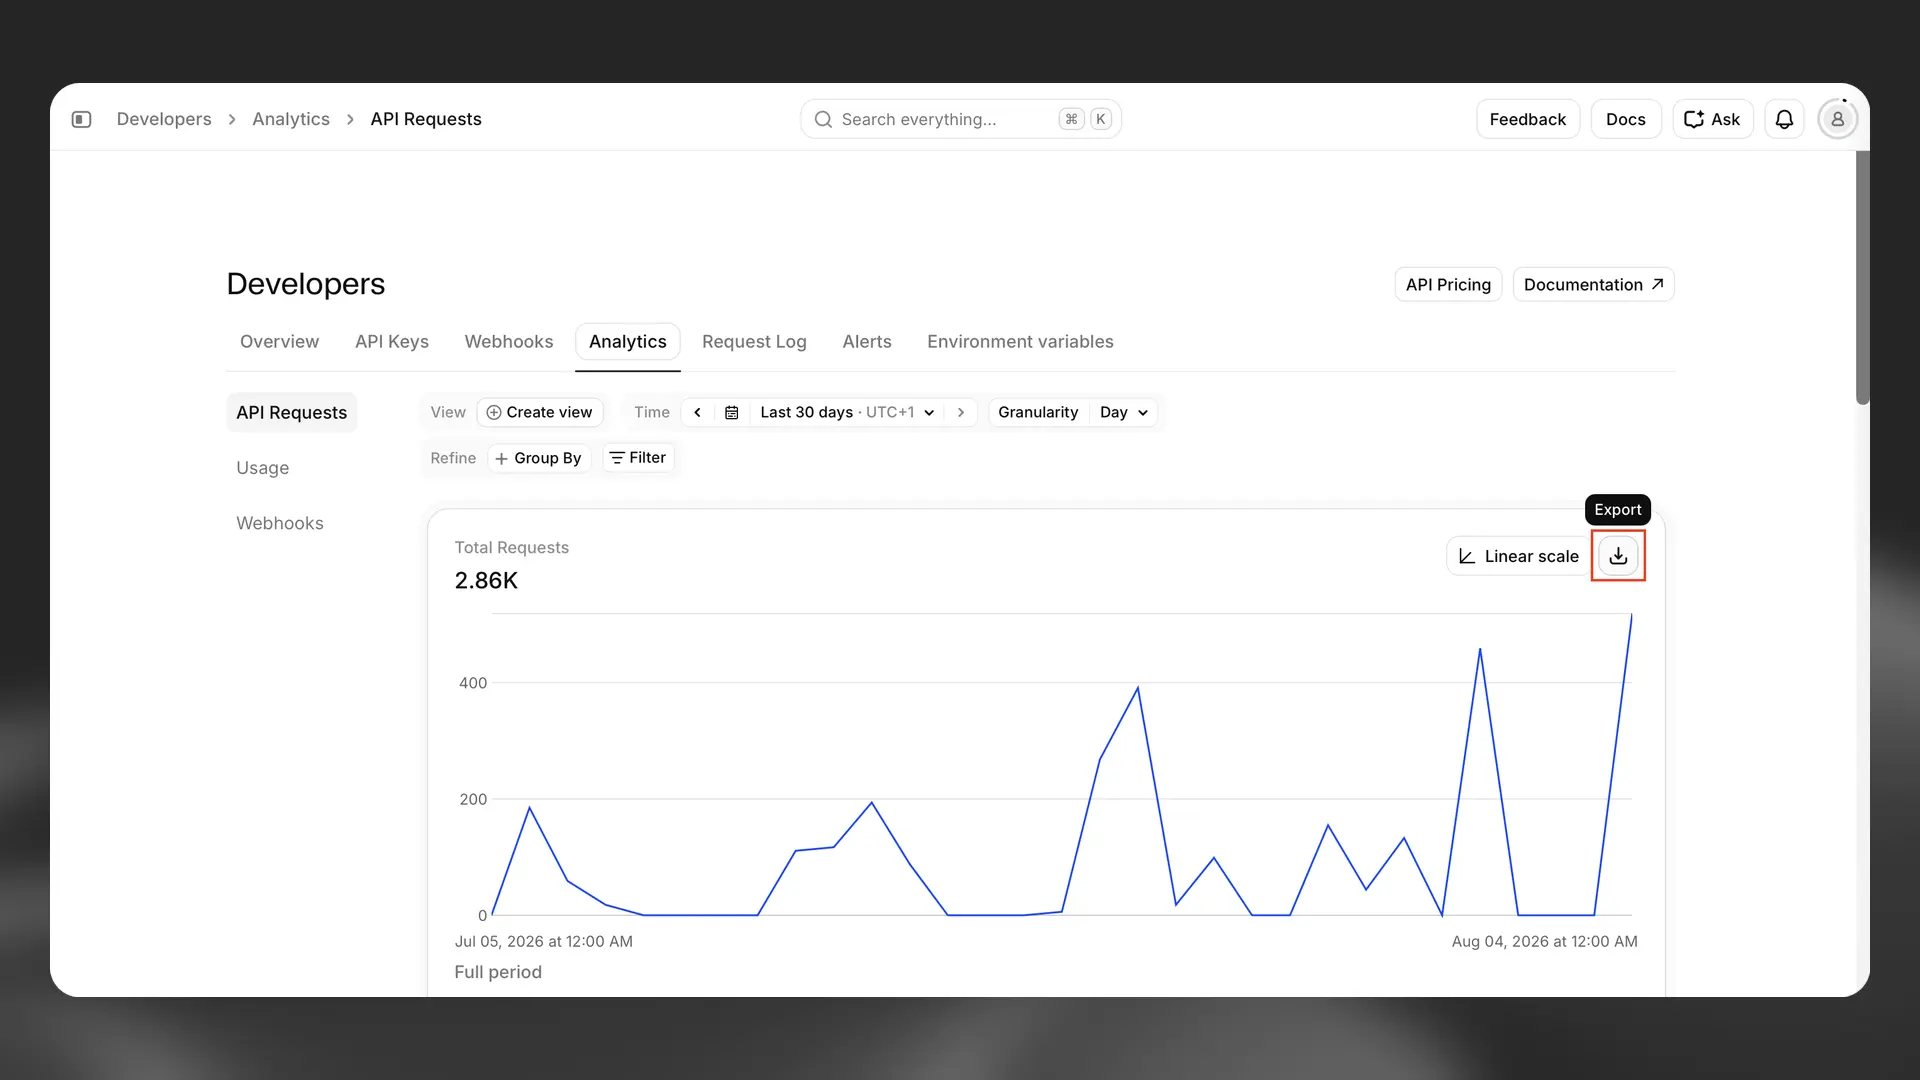
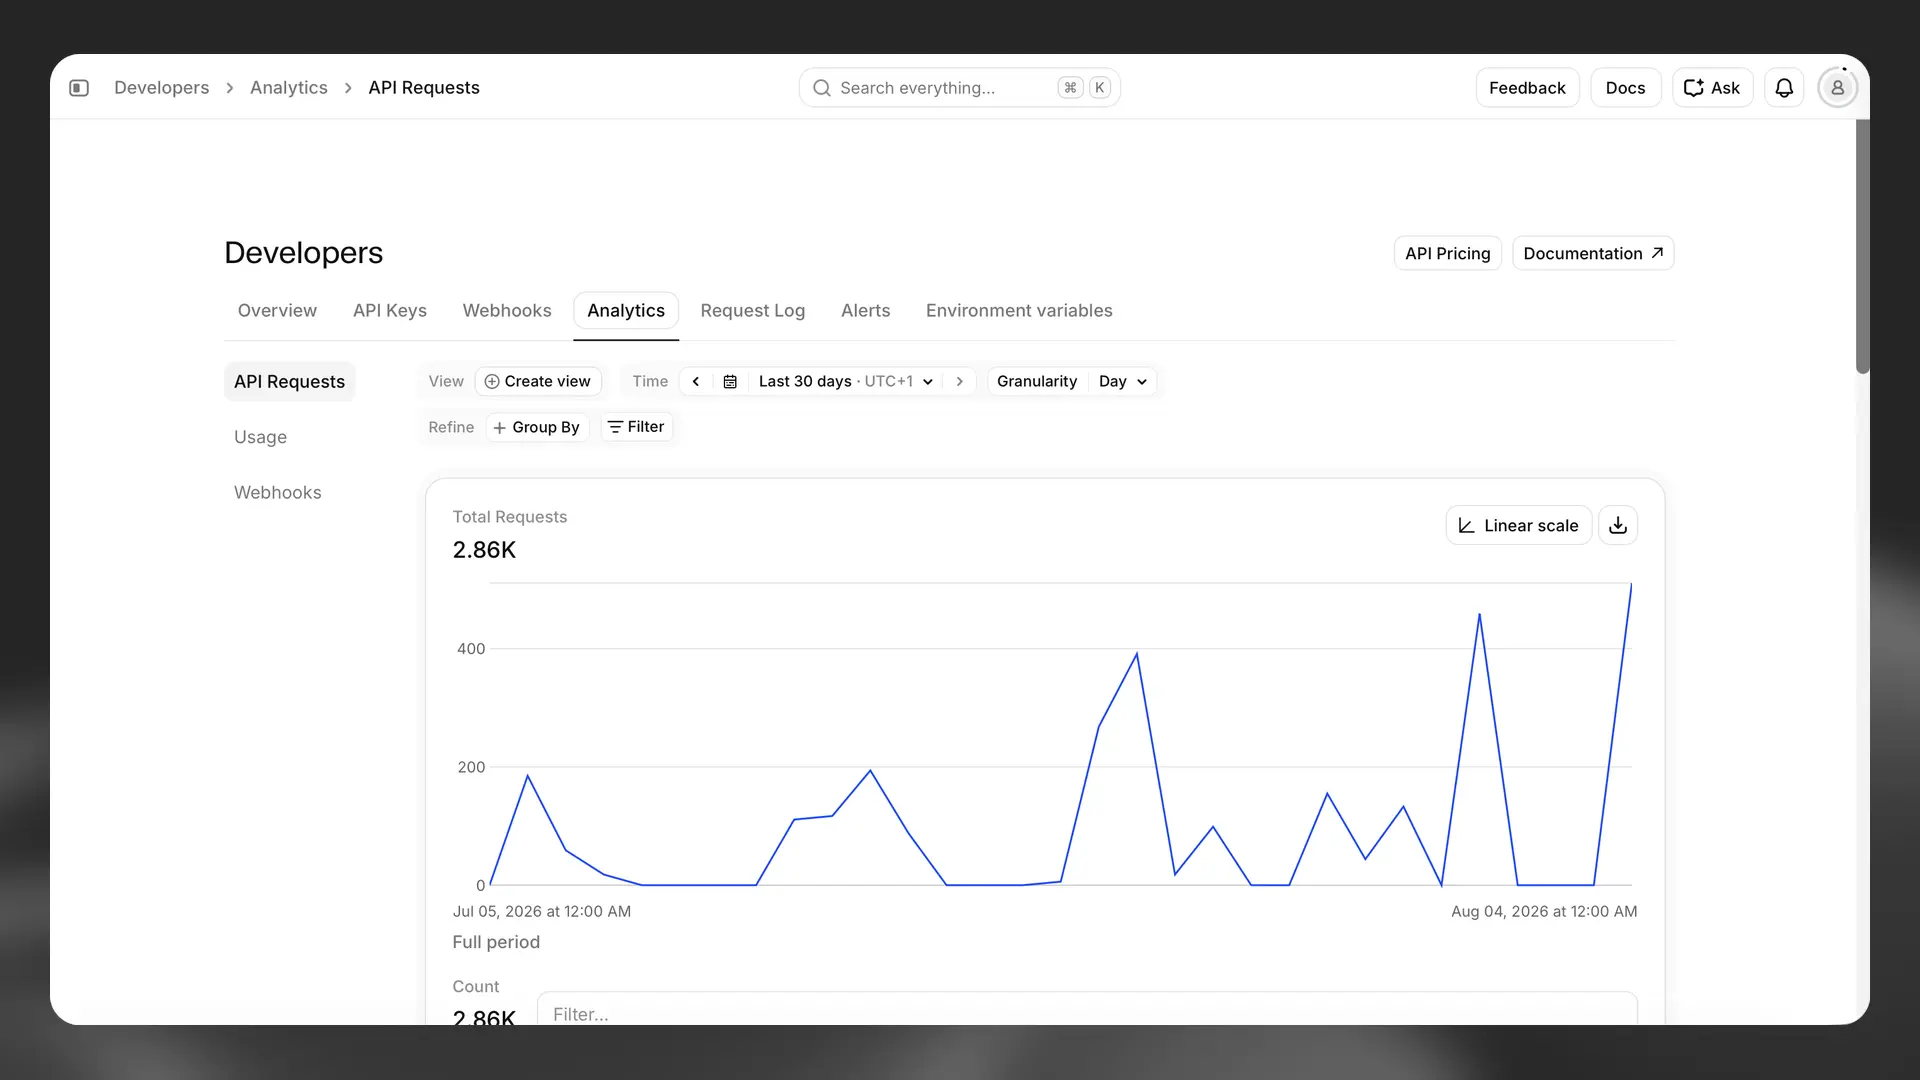
Section titled “API Requests”The API Requests view shows request volume and performance for your account or workspace. Metrics include:
- Total requests, which you can break down and filter
- Success rate
- Average latency
- Top called path
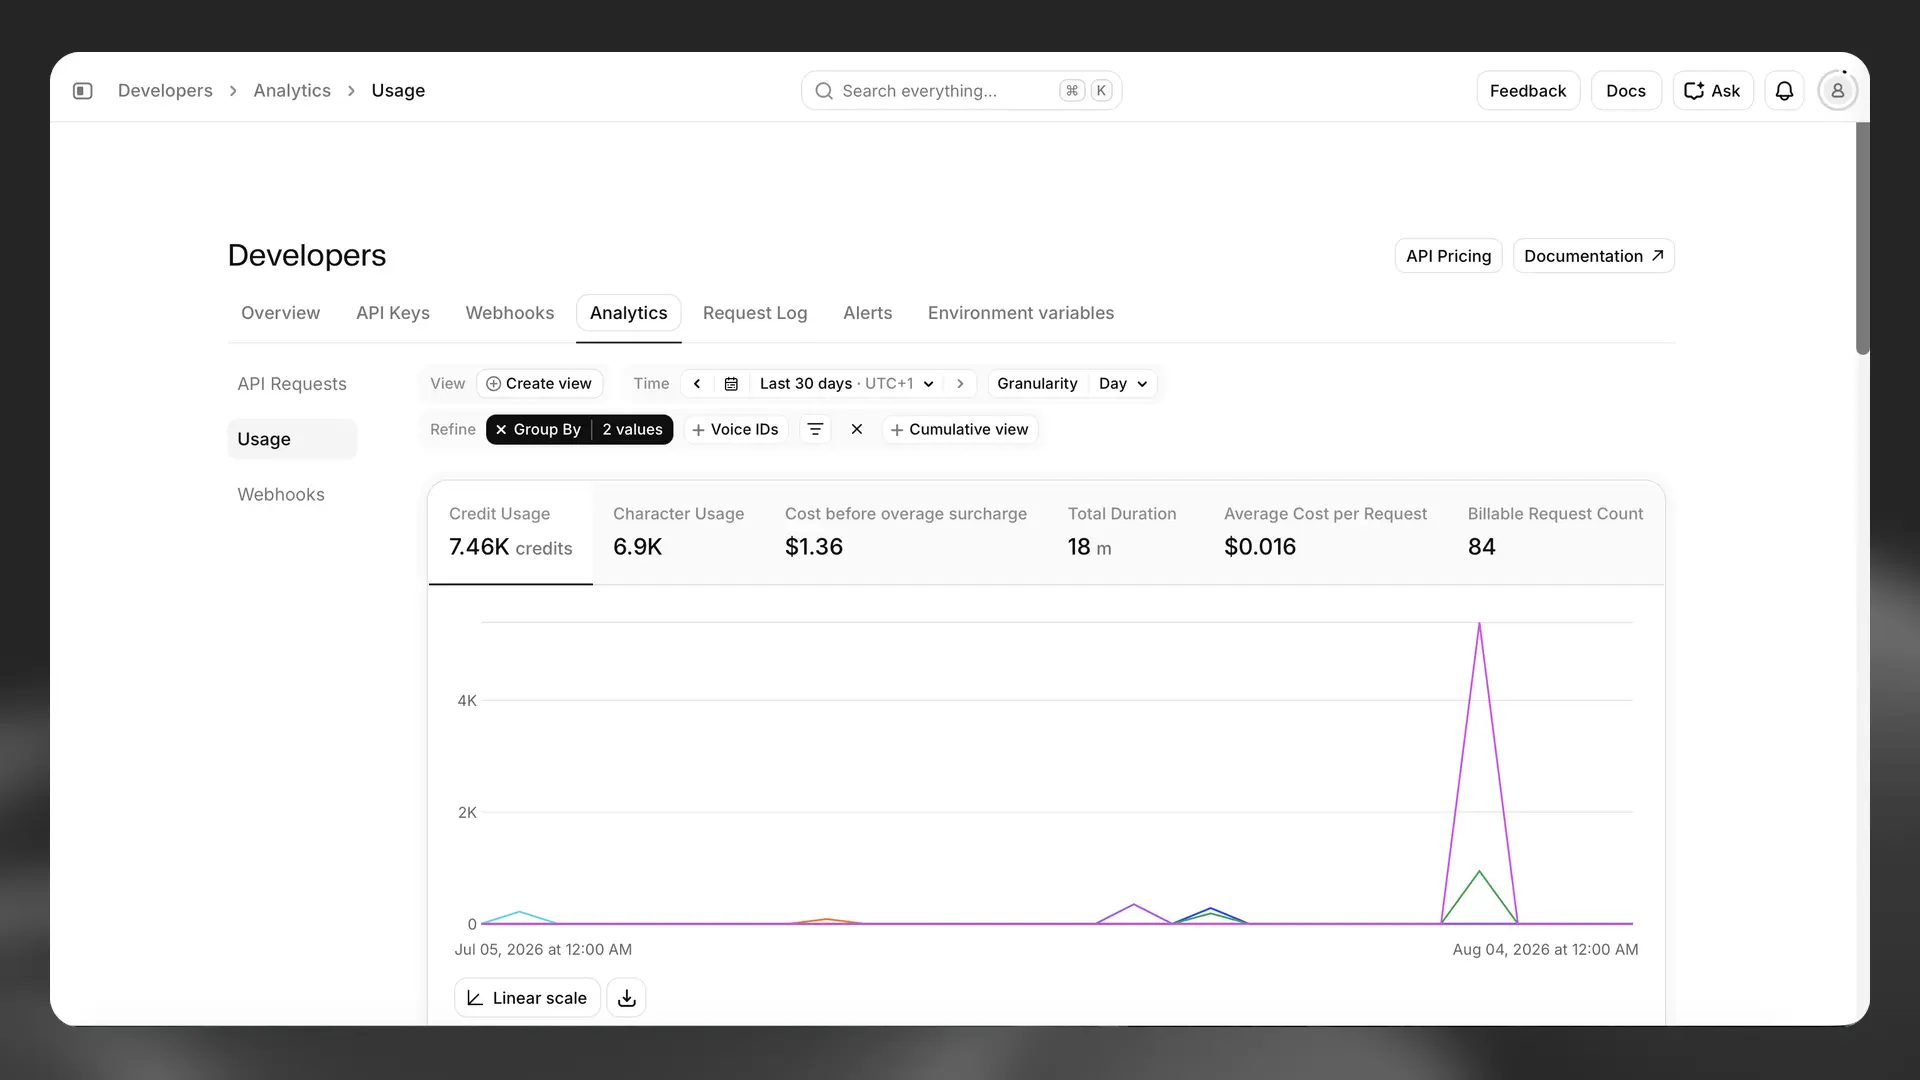
The Usage view shows credit consumption and related performance metrics. Metrics include:
- Credit usage, which you can break down and filter (for example, by voice, product, or API key)
- Average time to first byte
- Average time to completed transcript
- Concurrent requests
When viewing workspace usage, you can also break usage down by individual user or workspace group.
Webhooks
Section titled “Webhooks”The Webhooks view shows webhook delivery activity for your account or workspace. Metrics include:
- Total webhook calls
- Recent webhook calls
Request Log
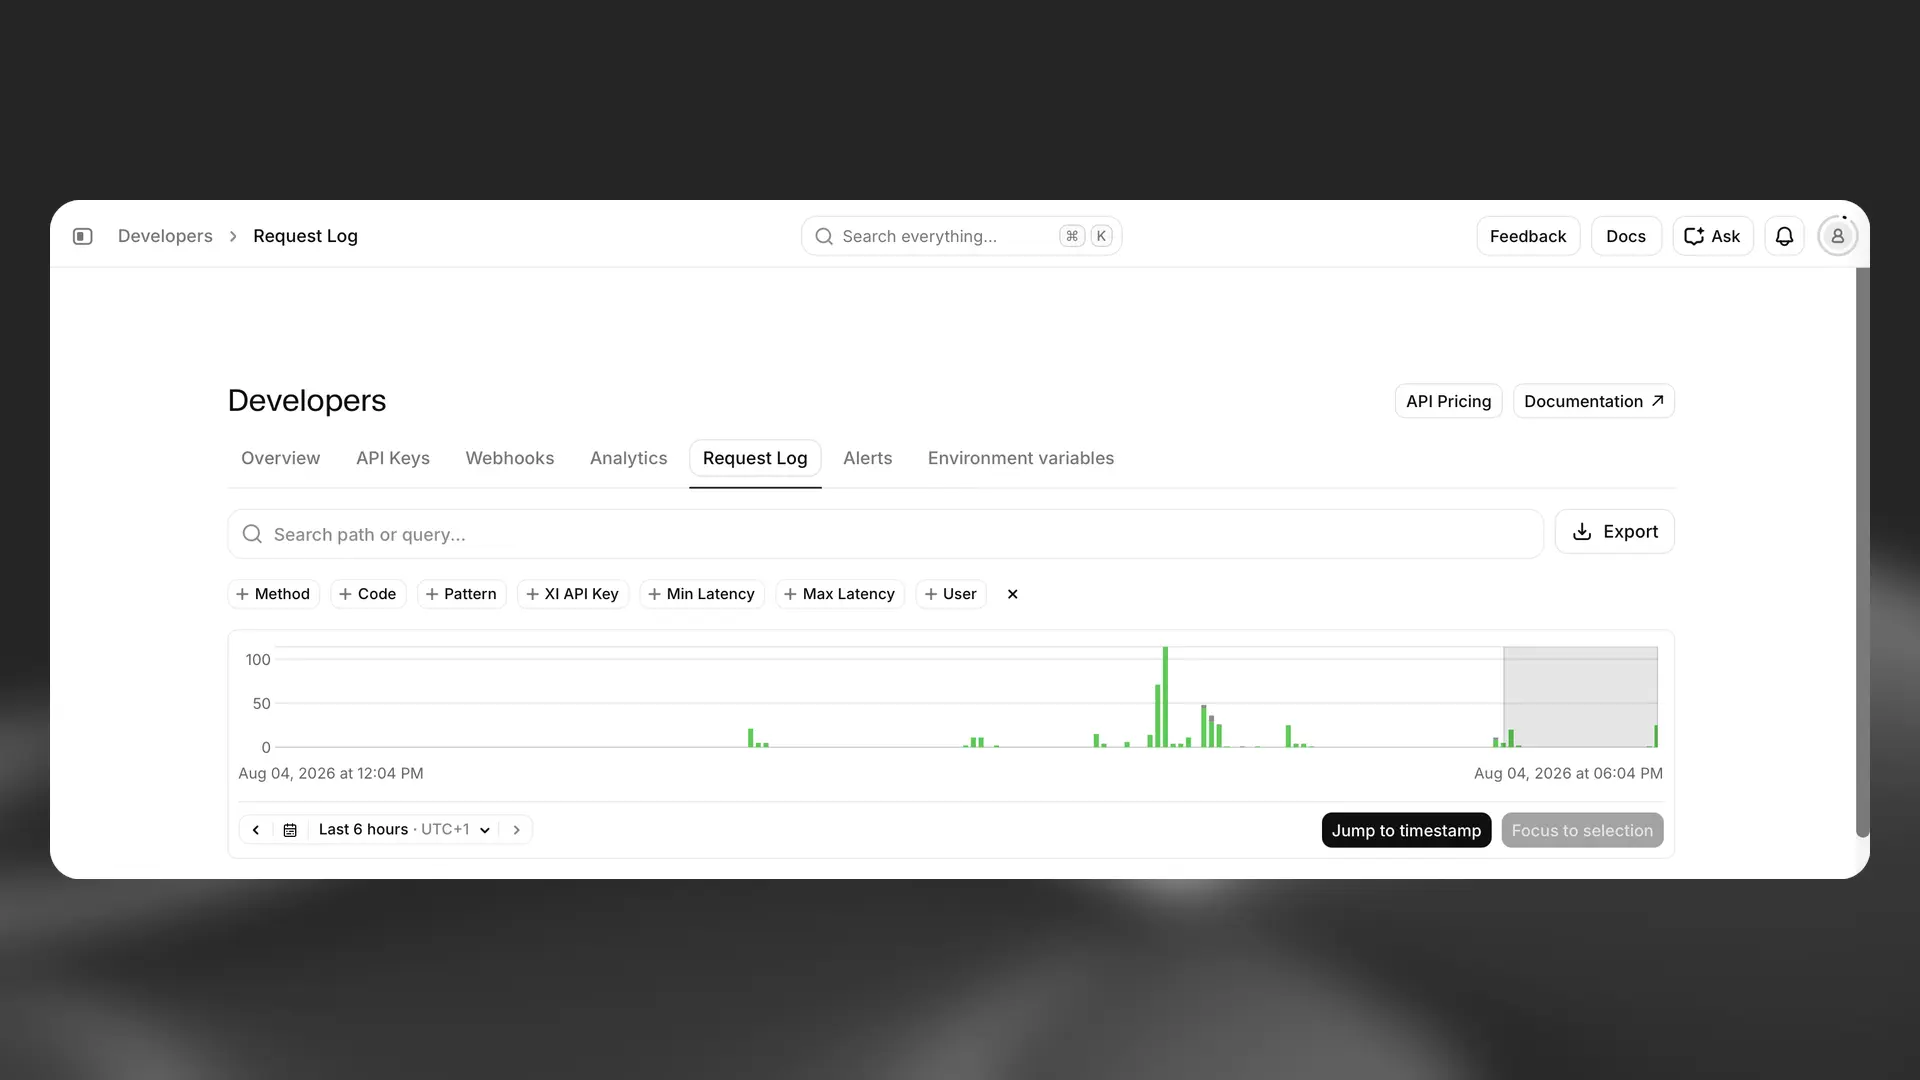
Section titled “Request Log”The Request Log tab lists all API requests for your account or workspace. Use search and filters to find specific requests for debugging and monitoring.
Export data
Section titled “Export data”You can export the data from your current view as a CSV file. Click Export to download it.