Analytics
Track agent performance, compare experiments, and identify optimization opportunities across your workspace
Overview
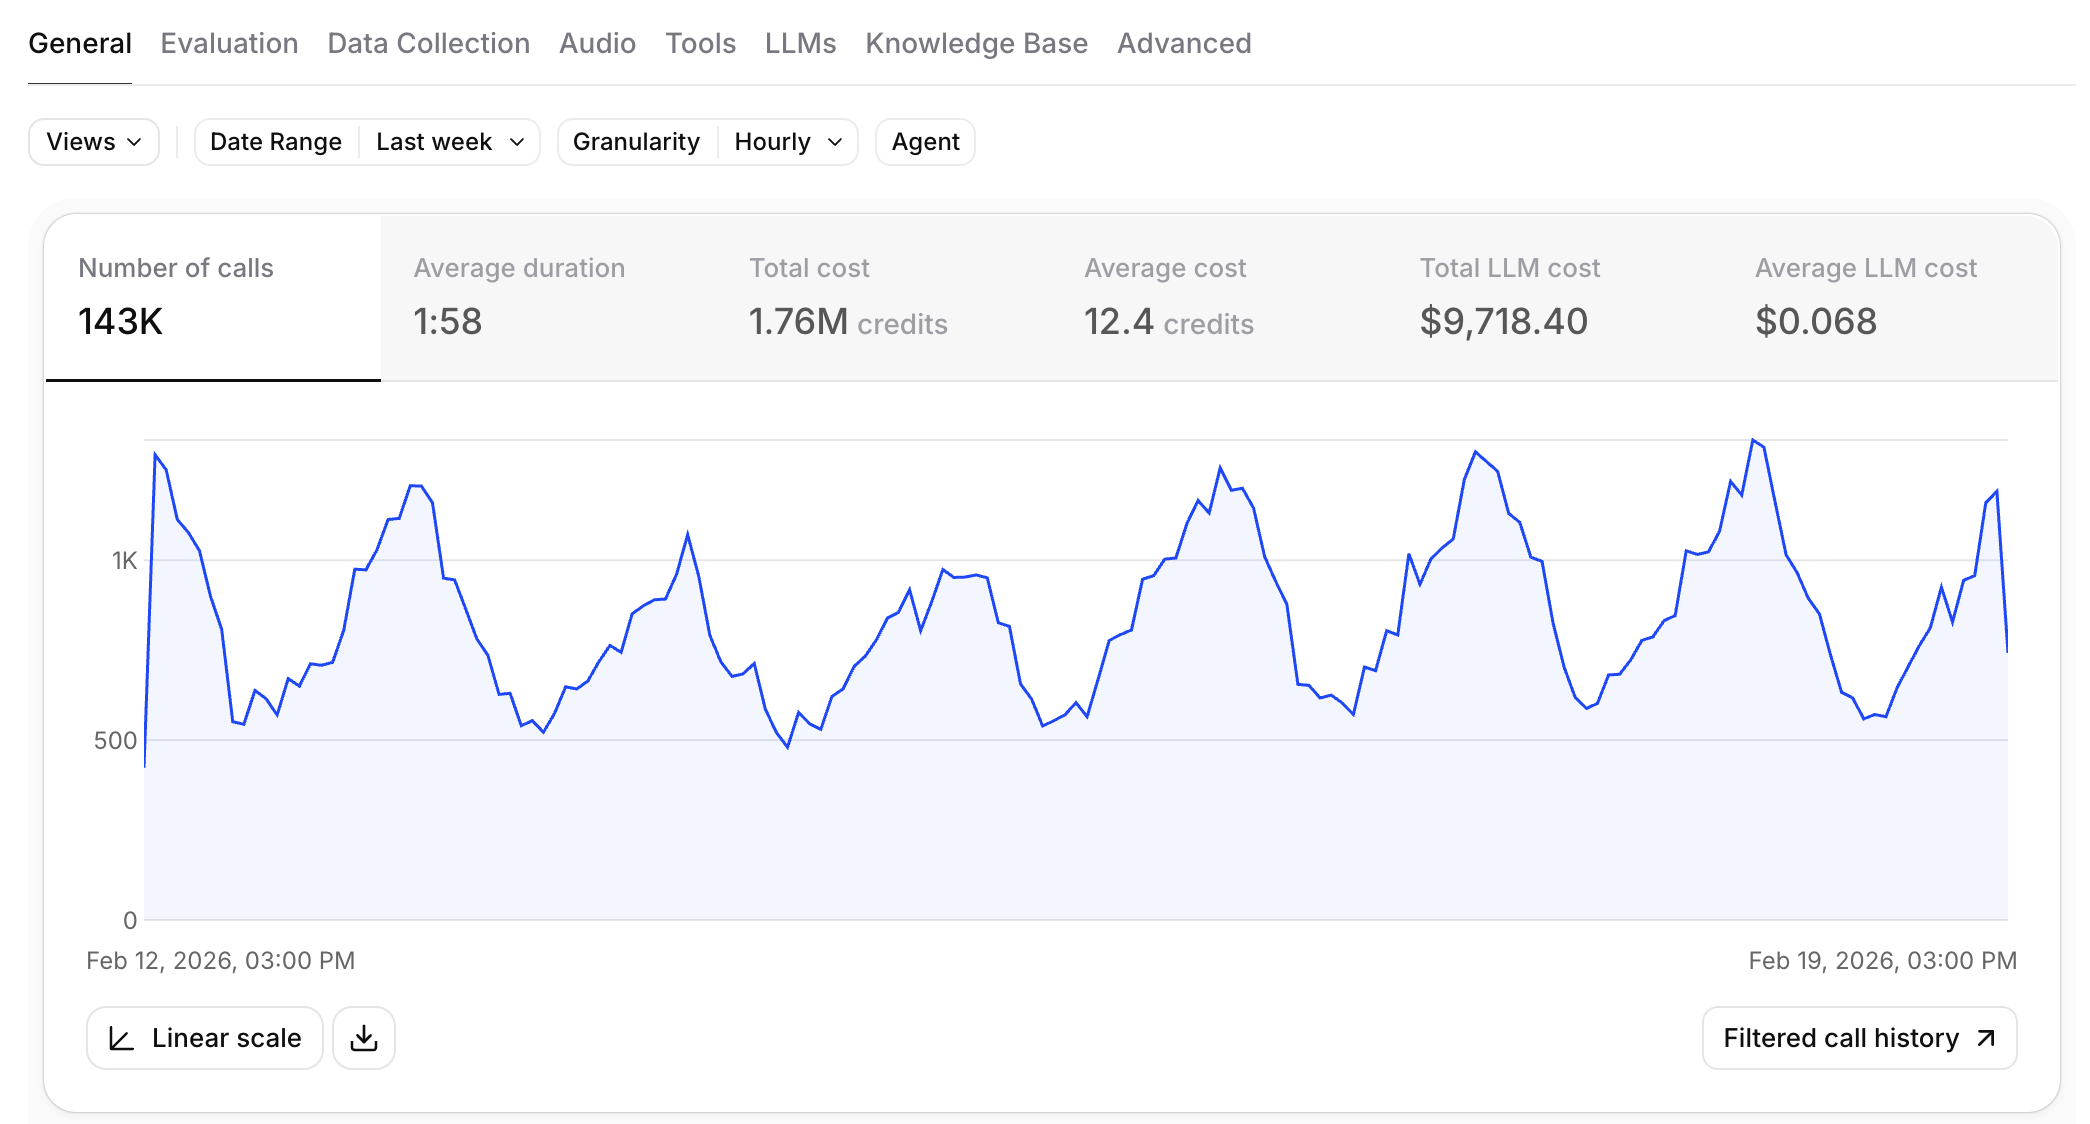
Section titled “Overview”The analytics dashboard provides granular, real-time metrics for your conversational agents. You can break down performance across multiple dimensions — by agent, branch, time period, language, call type, model, and more — to understand exactly how your agents are performing in production.
Analytics data is powered by a high-performance columnar database, enabling fast queries across large volumes of conversation data with flexible filtering and grouping.
For conversation-level themes, use Spotlight to review real-time insights, sentiment analysis, topic discovery, and the conversations behind each topic.
Accessing analytics
Section titled “Accessing analytics”Navigate to the Analytics tab in your agents dashboard. You can view metrics across your entire workspace or filter down to a specific agent.
When running experiments, you can jump directly to branch-filtered analytics from the agent configuration page using the View Analytics button. This pre-applies the agent and branch filters so you can compare variant performance immediately.
Time range and granularity
Section titled “Time range and granularity”Select the time range for your analysis using the date picker at the top of the dashboard. You can choose from preset ranges or define a custom window.
The dashboard automatically adjusts the granularity of time-series charts based on your selected range — hourly buckets for short ranges, daily or weekly for longer ranges.
Available metrics
Section titled “Available metrics”Conversations
Section titled “Conversations”- Call count — total number of conversations in the selected period
- Total duration — aggregate conversation time
- Average duration — mean conversation length
- Total cost — total spend across all conversations
- Average cost — mean cost per conversation
Performance
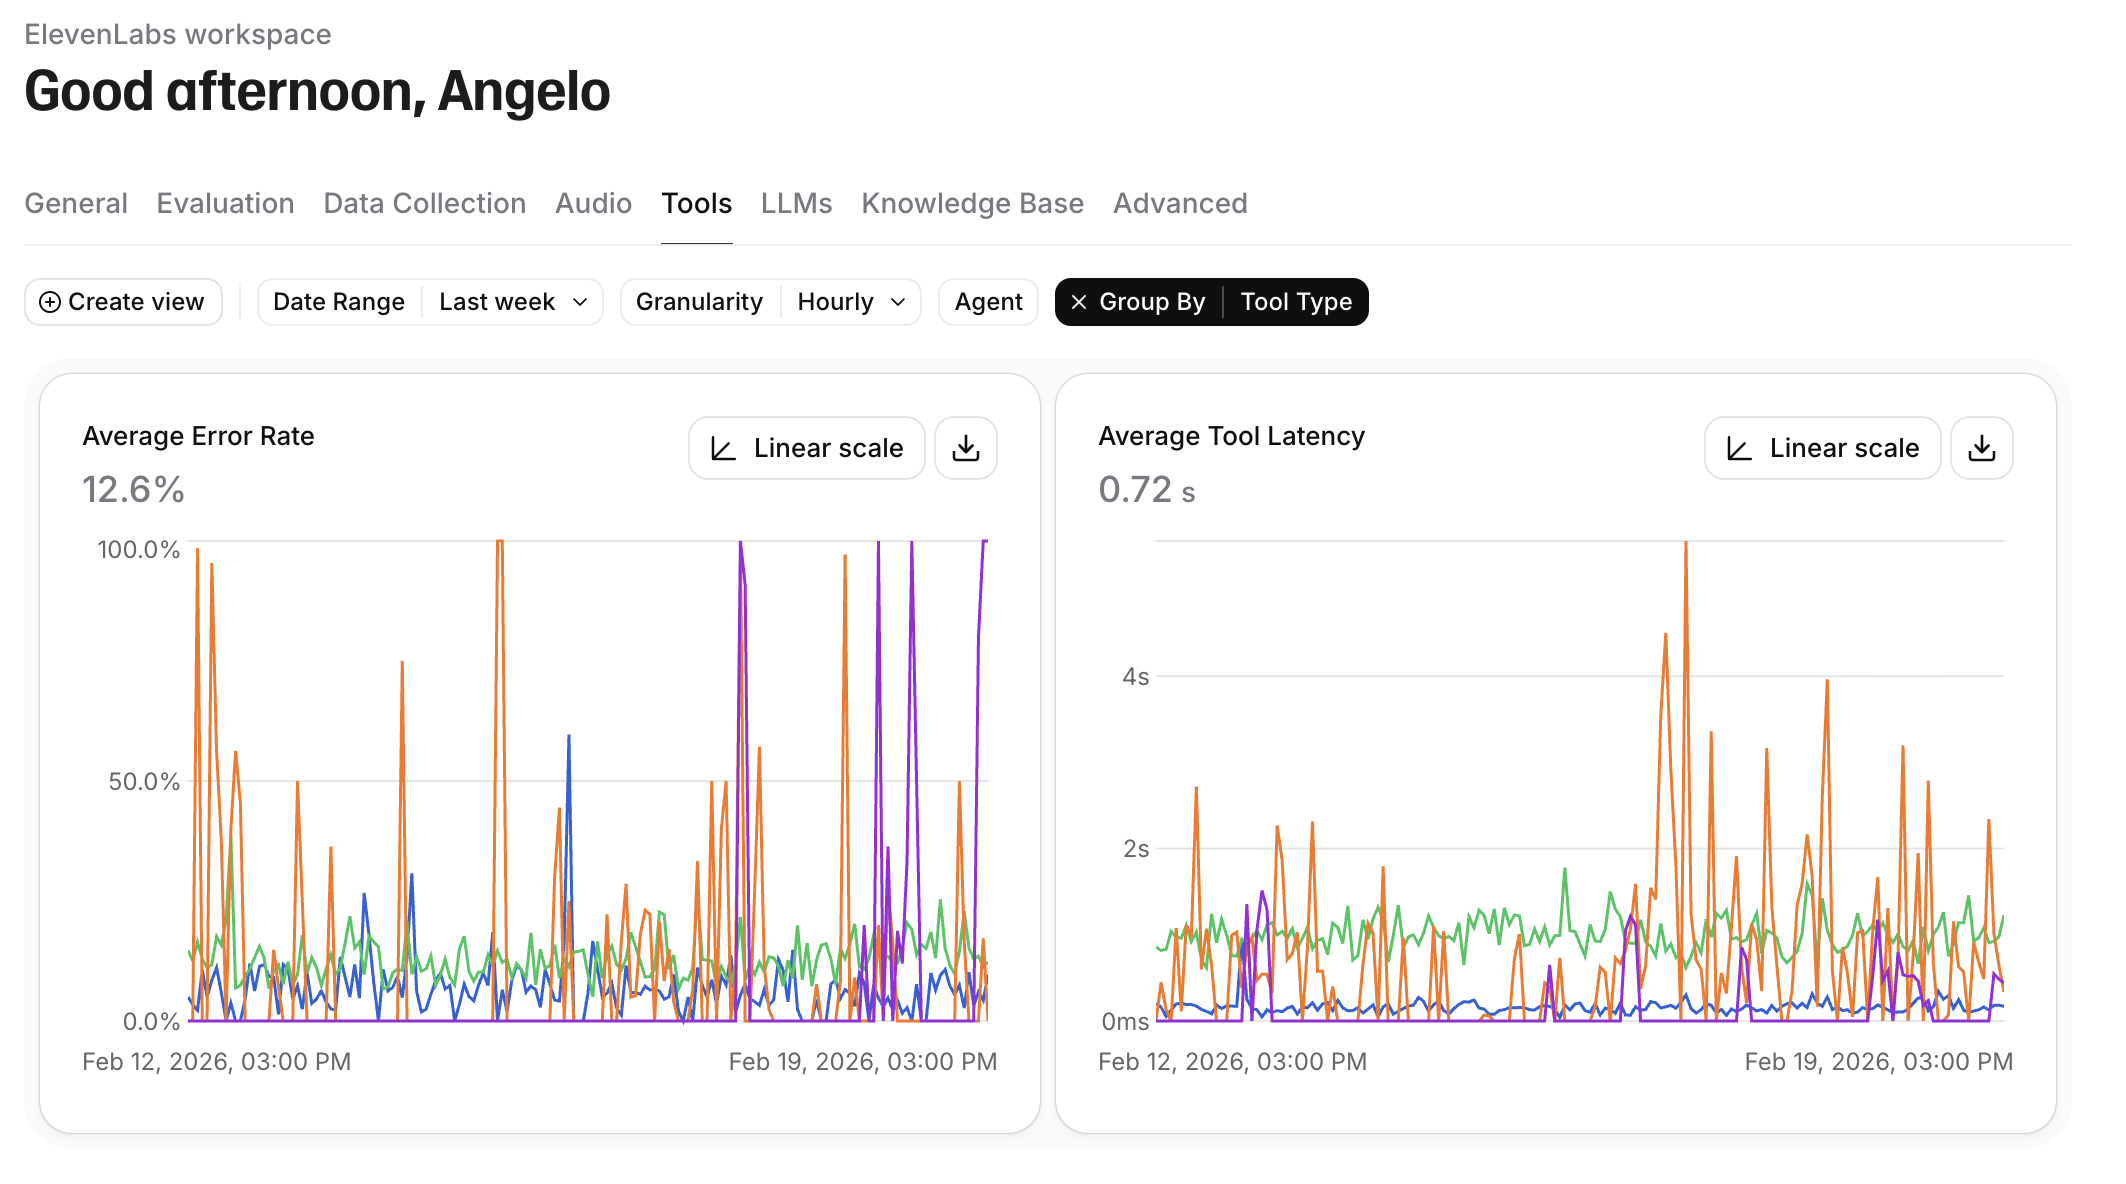
Section titled “Performance”- Agent response latency — time for the agent to respond (median and percentiles)
- Error rate — percentage of conversations with errors
- Error breakdown — errors categorized by type (tool failures, LLM errors, connection issues)
Success evaluation
Section titled “Success evaluation”If you have evaluation criteria configured, the dashboard shows success, failure, and unknown rates for each criterion. This is the primary way to measure business outcomes across experiments.
Data collection
Section titled “Data collection”If you have data collection configured, collected values are available as filterable dimensions in the dashboard.
Language breakdown
Section titled “Language breakdown”See the distribution of conversations across languages. This is useful for understanding multilingual adoption and comparing agent performance across different languages.
Active calls
Section titled “Active calls”The dashboard displays the current number of active calls in real time. This reflects ongoing sessions across your workspace and is also available via the API.
Filtering
Section titled “Filtering”Narrow your analytics view by applying filters on any combination of dimensions:
| Filter | Description |
|---|---|
| Agent | View metrics for a specific agent |
| Branch | Compare performance across experiment branches |
| Call type | Filter by inbound, outbound, or web calls |
| Language | Filter by conversation language |
| Conversation source | Filter by how the conversation was initiated (widget, phone, API) |
| LLM model | Compare performance across different language models |
| TTS model | Compare performance across text-to-speech models |
| ASR model | Compare performance across speech recognition models |
| Tool type | Filter by specific tools used in conversations |
| Error type | Isolate conversations with specific error categories |
| Evaluation criteria | Filter by success evaluation results |
Grouping
Section titled “Grouping”Group metrics by any of the filterable dimensions to break down aggregate numbers.
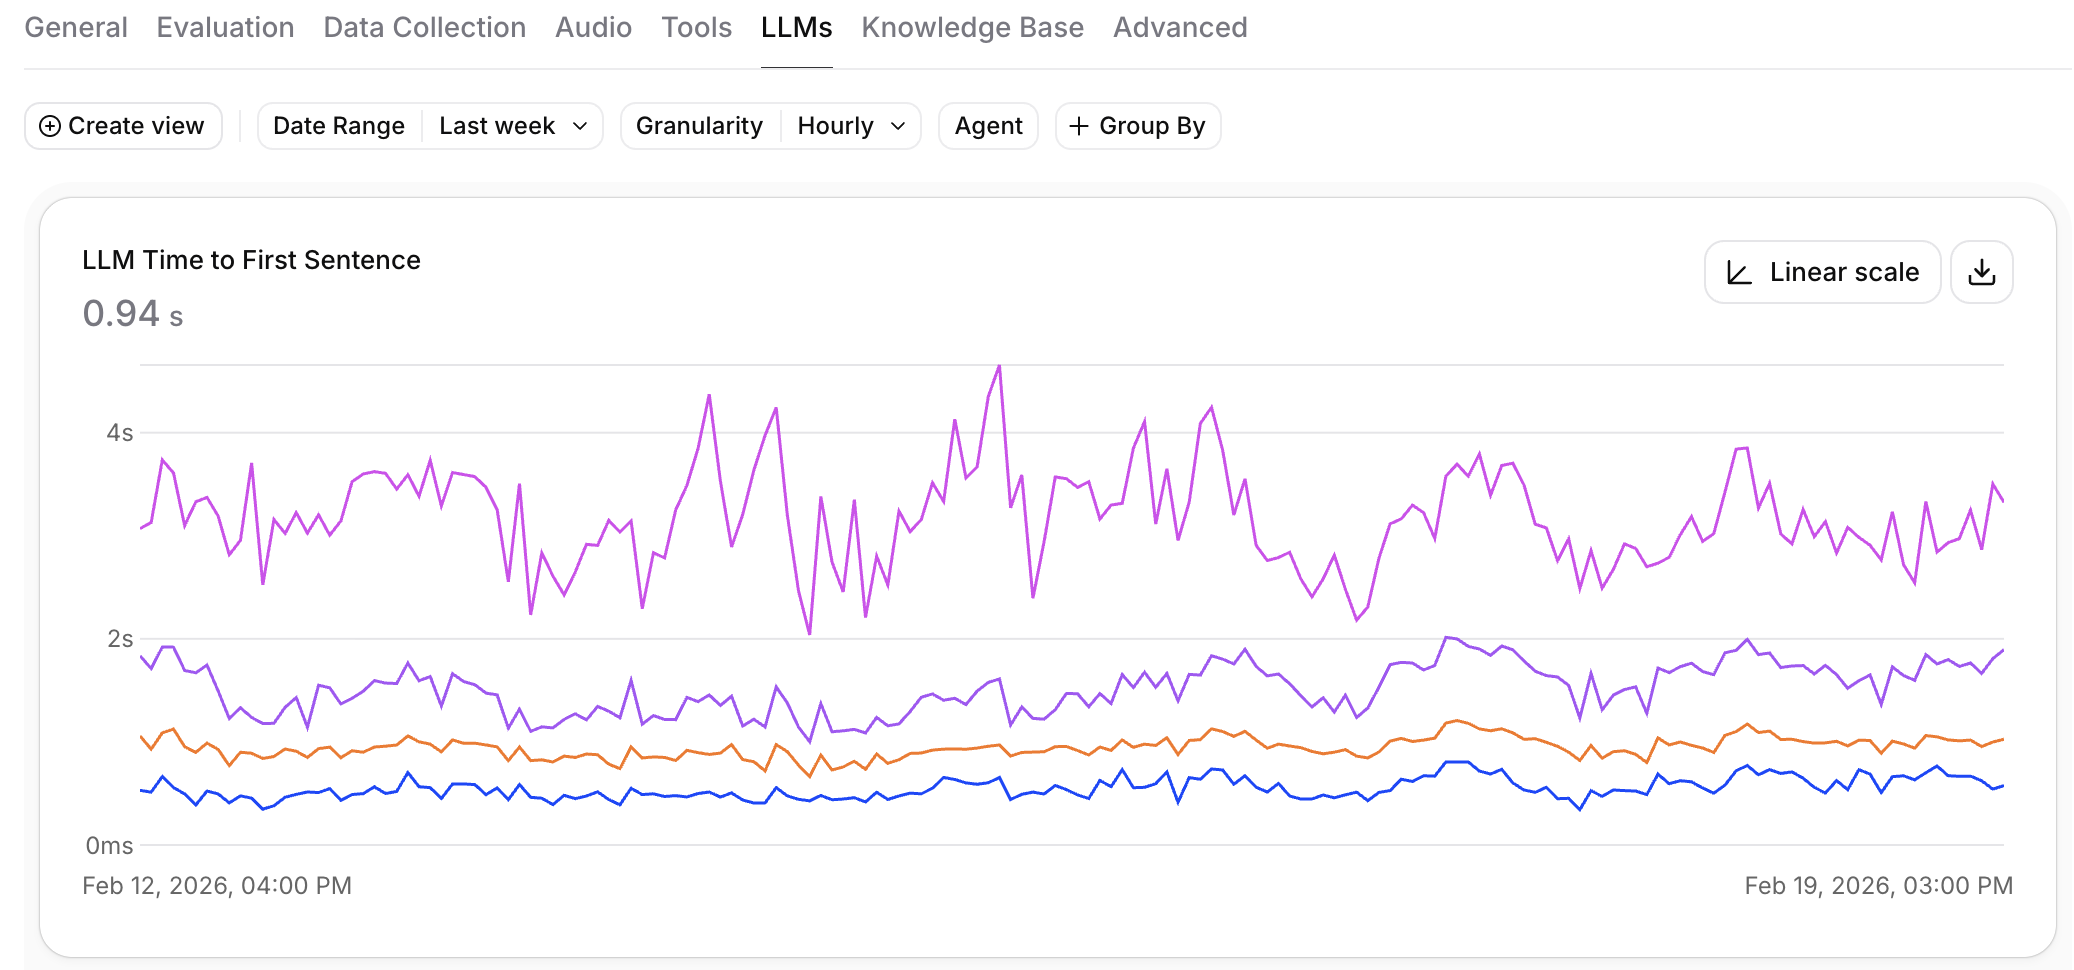
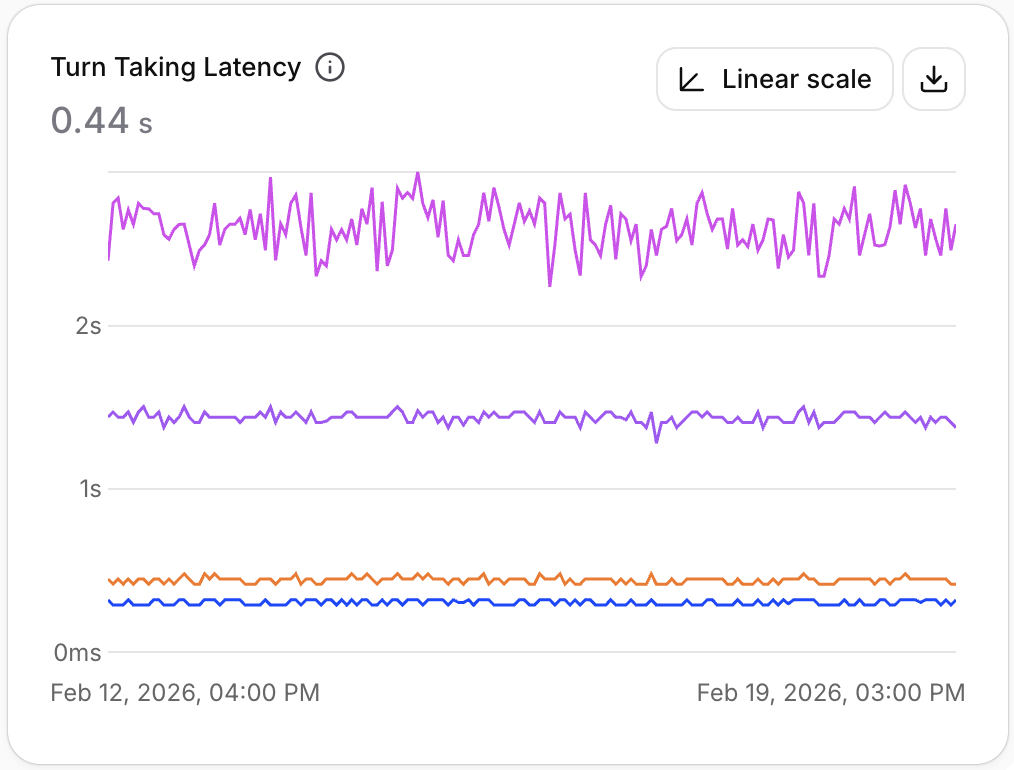
For example:
- Group by branch to compare experiment variants side by side
- Group by language to see how agents perform across languages
- Group by LLM model to compare model performance and cost
- Group by call type to understand differences between inbound and outbound calls
Multiple grouping dimensions can be combined for deeper analysis.
Workflow analytics
Section titled “Workflow analytics”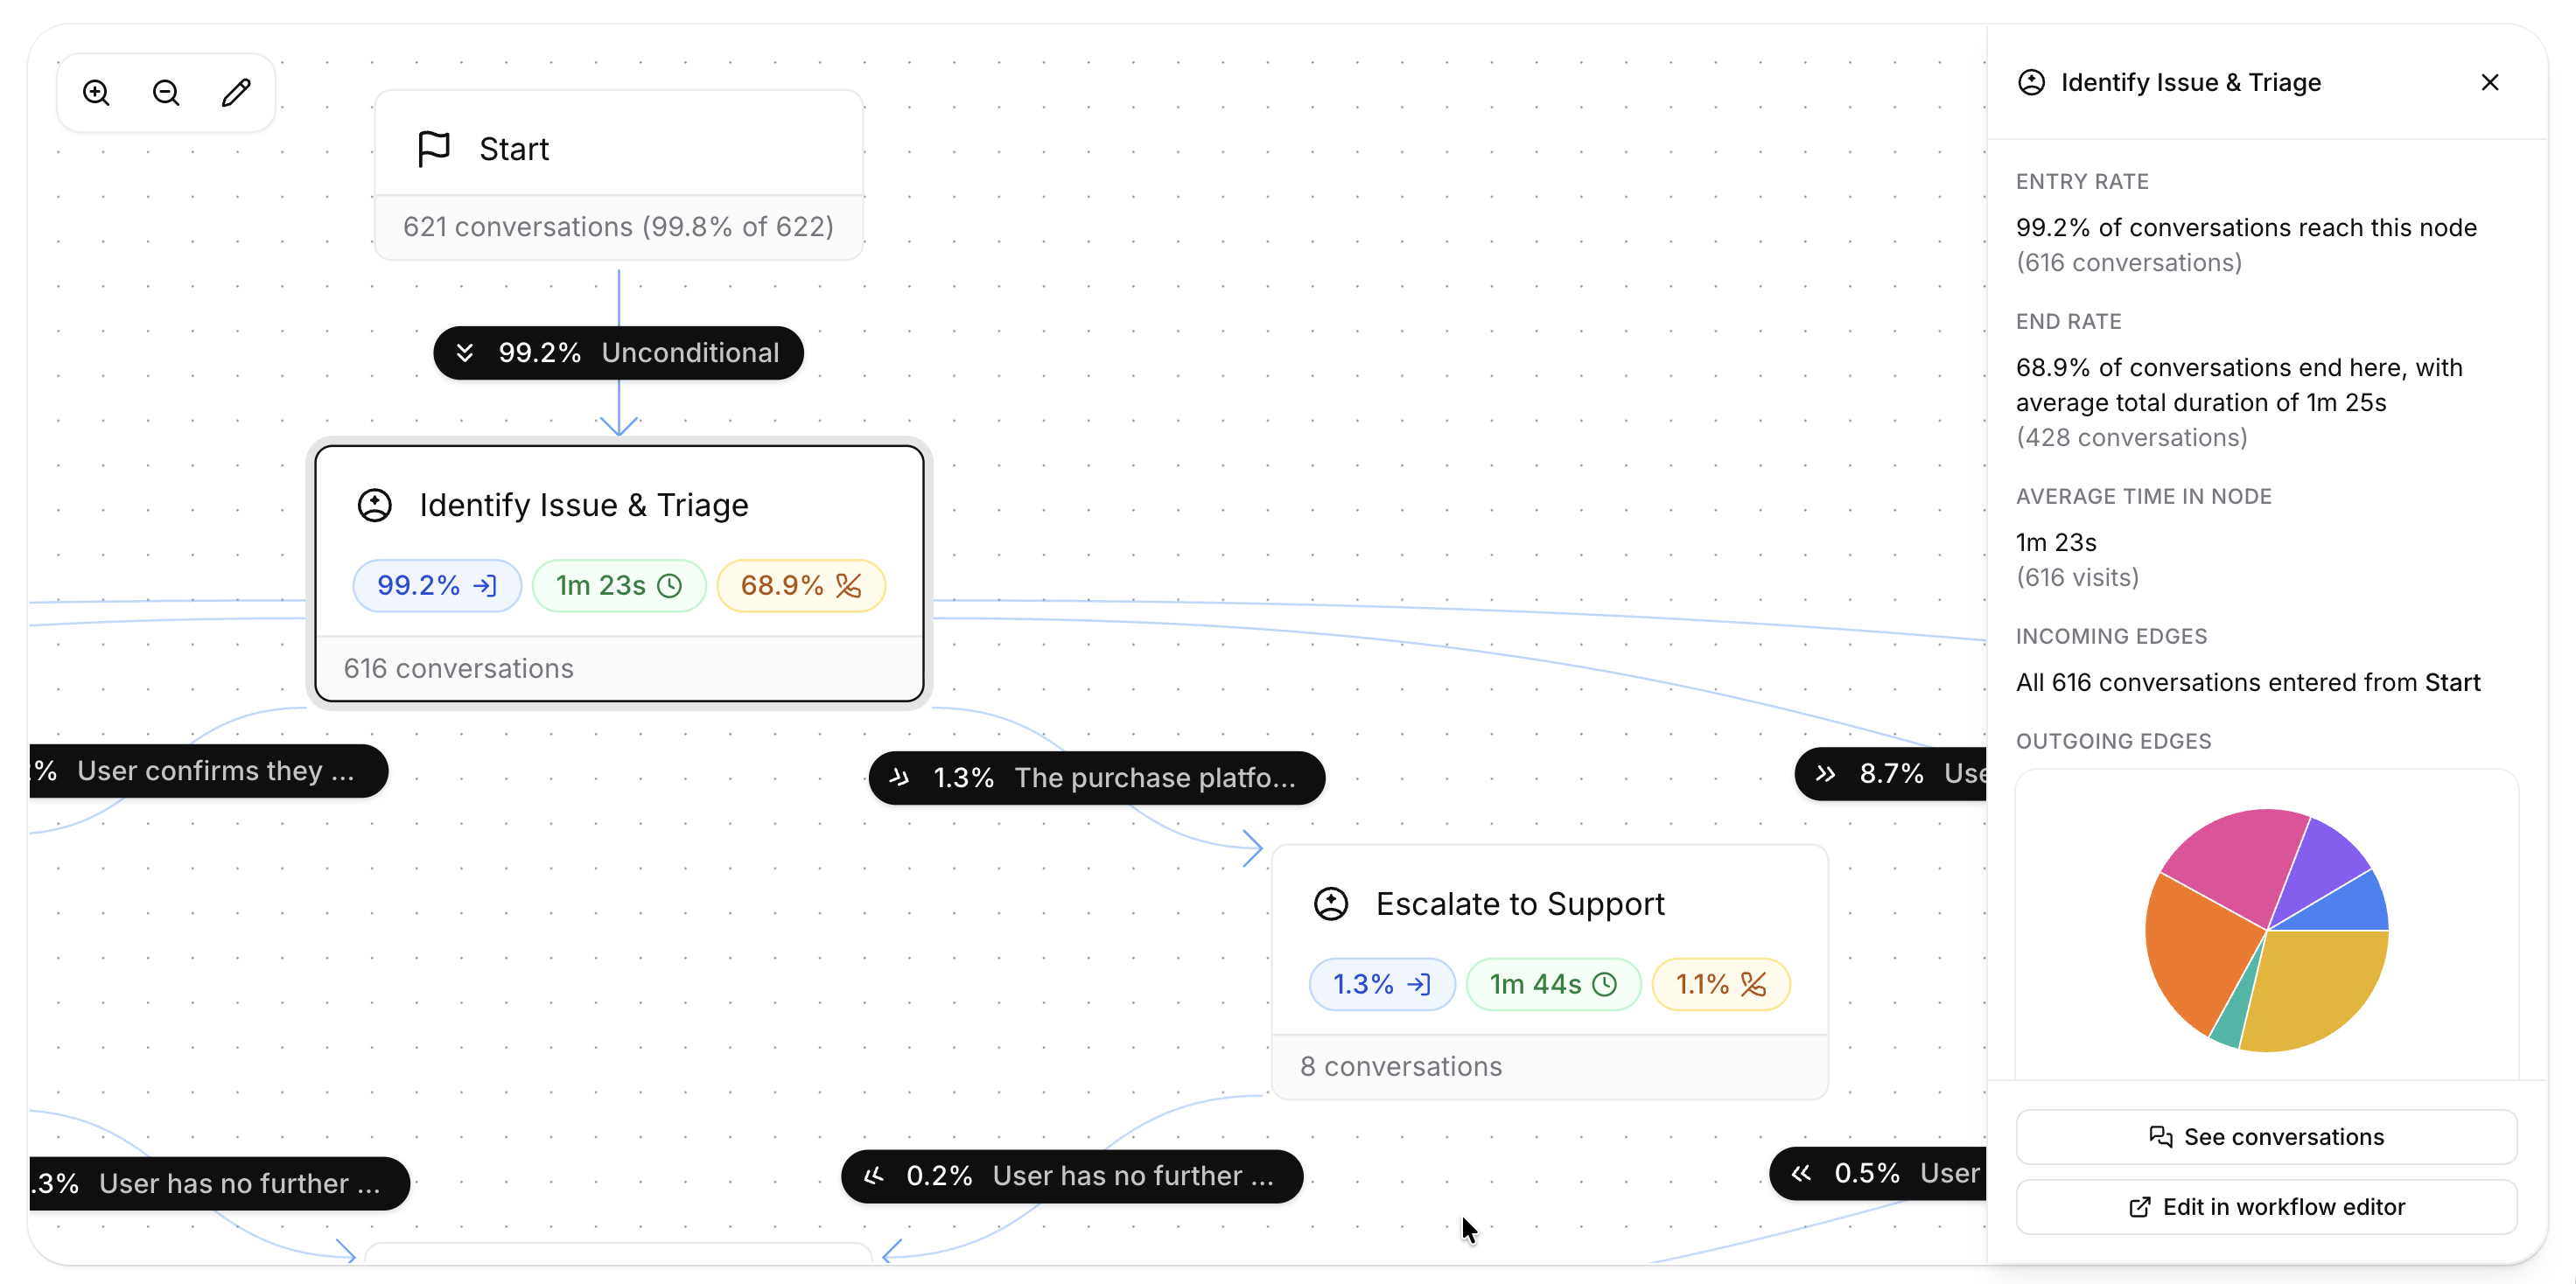
For agents with a workflow, the Workflow tab in the analytics dashboard overlays usage metrics directly on the workflow graph. Select an agent that uses a workflow to enable the graph view — you can then visualize conversation flow and traffic volume directly on the workflow canvas, with detailed inflow and outflow for every node.
Node metrics
Section titled “Node metrics”Click any node in the workflow graph to open the inspector and see:
- Entries — how many conversations entered the node in the selected time range
- Average time spent — how long the node was active on average across those entries
- Terminations — how many conversations ended while the node was active
- Incoming and outgoing flow — the distribution of conversations entering from each upstream edge and exiting through each downstream edge
Drilling into conversations
Section titled “Drilling into conversations”From the node inspector, click See conversations to jump to the conversation history page filtered to that node. This applies the Node entered filter — a history filter scoped to a specific agent that surfaces every conversation whose transcript entered the selected workflow node at least once.
The Node entered filter is also available directly from the conversation history page.
Using analytics with experiments
Section titled “Using analytics with experiments”Analytics is the primary tool for measuring experiment outcomes. The recommended workflow:
Filter by agent
Select the agent running your experiment.
Group by branch
Break down all metrics by branch to see variant-level performance.
Compare key metrics
Look at the metrics that matter for your hypothesis — success evaluation results, conversation duration, cost, error rates.
Decide and act
When one variant consistently outperforms, increase its traffic share or merge it to main.
You can jump directly to this view from the agent configuration page by clicking the View Analytics button next to your traffic deployment settings. This pre-applies the correct agent and branch filters.